XAU/USD
2,645.00
0.00(0.00%)
Real Account Records

Every Trade.
Every Week.
Every Month.
No Exceptions.

Weekly and monthly screenshots from a live US Cent account. Winning weeks, losing weeks — everything posted, nothing skipped. If a week was red, you will see it here.

All records from a live US Cent account running XAUUSD.c. Past performance does not guarantee future results. Review drawdown alongside returns.

Record Snapshot

Real Account

Weekly

Aug 24 — Aug 30

Trades

43

Net Result

+864.50 USC

Win Rate

51.2%

Monthly

August 2026

Trades

112

Net Result

+374.98 USC

Win Rate

39.3%

XAUUSD.c
SymbolUS Cent

Live US Cent Account · Updated weekly

Transparency First

Why Trading Records Matter

Most traders judge a system by a single number — a growth rate, a myfxbook link, a backtest curve. But one figure conceals everything that actually determines your experience: the frequency of drawdowns, the duration of recoveries, and whether winning streaks are skill or coincidence. Weekly and monthly records expose the full rhythm — the cadence of losses, the shape of risk, and the real story behind the final tally.

Frequency Over Snapshot

A single screenshot proves nothing. Anyone can cherry-pick a winning day or quietly skip a brutal week. What matters is the unbroken sequence — every Monday, every Friday, posted regardless of outcome. Over months, this frequency builds a statistical footprint you can actually read: win-rate stability, drawdown recurrence, and the real ratio of green weeks to red. Without frequency, you are gambling on a highlight reel. With it, you are evaluating a system.
Drawdown Visibility

A 66% maximum drawdown is just a number on a spec sheet — abstract, easy to dismiss with 'I can handle that.' But when you watch it unfold week by week across a live record, it stops being a statistic and starts being an experience. You see the account climb, stall, reverse, and slowly claw back over days and weeks. You feel the duration: not just how deep it went, but how long it stayed underwater before recovery began. That gap between knowing a risk exists and understanding what it costs to live through it — the records close that gap.

Context, Not Hype

Every performance number has a story behind it that the number itself erases. A +$312 monthly peak sounds impressive — until you learn it was followed by a -$245 reversal within the same 30 days. A 54% win rate means nothing without knowing the average win-to-loss ratio. The records provide the narrative that raw statistics strip away: which market conditions produced gains, which triggered losses, and whether the system behaved consistently with its design intent. Without context, you are not informed — you are just impressed, or worried, for the wrong reasons.

Weekly Record

Weekly Trading Record

Aug 24 — Aug 30, 2026

Weekly XAUUSD Trading Record Screenshot
Click to Expand
MT5 Account Statement — Weekly

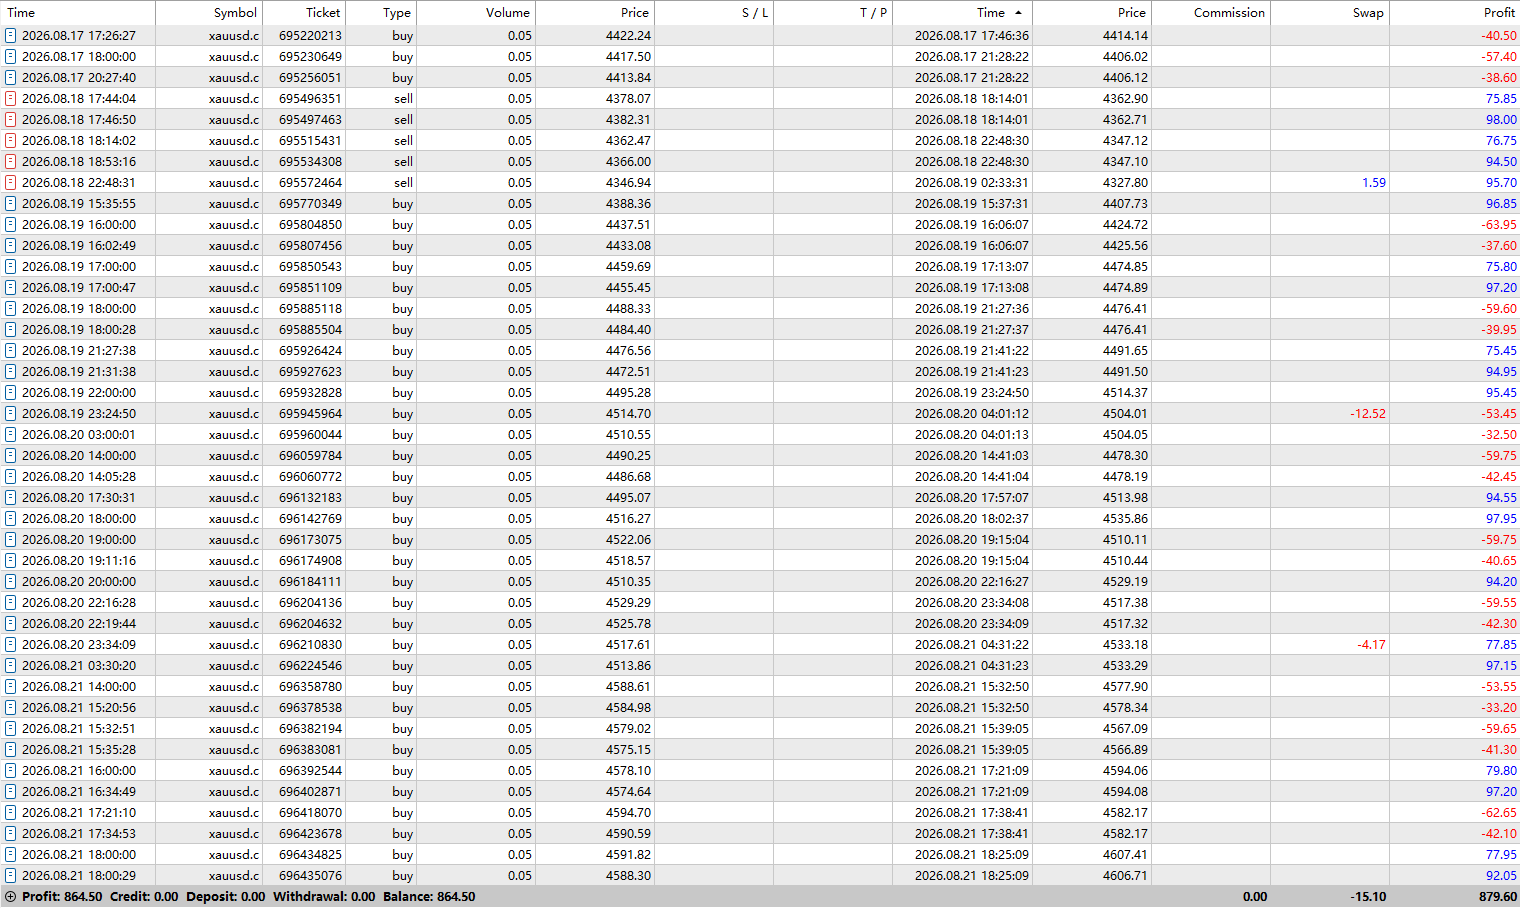
The EA finished the week with a strong recovery, delivering a net result of +864.50 USC from 43 XAUUSD trades. Closed trades generated +879.60 USC in trading profit, while -15.10 USC in overnight swap slightly reduced the final result. No commission was charged. The week showed a much healthier trade distribution compared with recent negative periods. The EA recorded 22 winning trades and 21 losing trades, producing a win rate of 51.2%. Profits were built through multiple successful positions rather than relying on only one or two large winners.

1

Monday started positively with buy positions. After two early winners of +77.05 USC and +96.20 USC, several smaller losses followed, but the session still remained profitable. The later sell positions also performed well, allowing Monday to close with a strong positive contribution.

2

Tuesday continued the recovery. Sell trades performed effectively, with several winners above +75 USC, including a position that gained +98.00 USC. One overnight position generated +1.59 USC in swap, helping offset holding costs.

3

Wednesday was the most challenging session. The EA switched back to buy positions and experienced a mixed result. Several profitable trades above +90 USC appeared, but they were offset by a number of losing entries. The session remained close to balanced rather than strongly positive.

4

Thursday produced the largest improvement. Buy positions captured the upward movement in gold, including several wins around +95 USC to +98 USC. Although some positions were stopped out, the overall session added meaningful gains to the weekly result.

5

Friday maintained the positive momentum. The EA continued using buy setups, and the largest single win of the week reached +126.95 USC. Despite several losing trades, the session finished strongly enough to secure the weekly gain.

Trades This Week

43

Win Rate

51.20%

Net Result

+864.50 USC

Largest Win

+126.95 USC

Largest Loss

-63.95 USC

Avg Hold Time

2.8 hrs

This was one of the stronger weeks in the recent record. Unlike previous losing periods where repeated small losses accumulated faster than winning trades, this week showed a more balanced distribution between winners and losers. Trading profit reached +879.60 USC, while -15.10 USC in swap reduced the final result to +864.50 USC. All figures are shown in USC account currency.

From One Week to One Month

A single week is a snapshot. Stack enough weeks together, and patterns emerge — the real rhythm of the account. Below is the full monthly record, compiling every weekly session so you can see whether the system held up across the entire September 2026 period.

The weekly record tells you what happened. The monthly record tells you whether it mattered — tracking the full arc from drawdown to recovery, not just a handful of trading sessions.

Monthly Record

Monthly Trading Record

September 2026

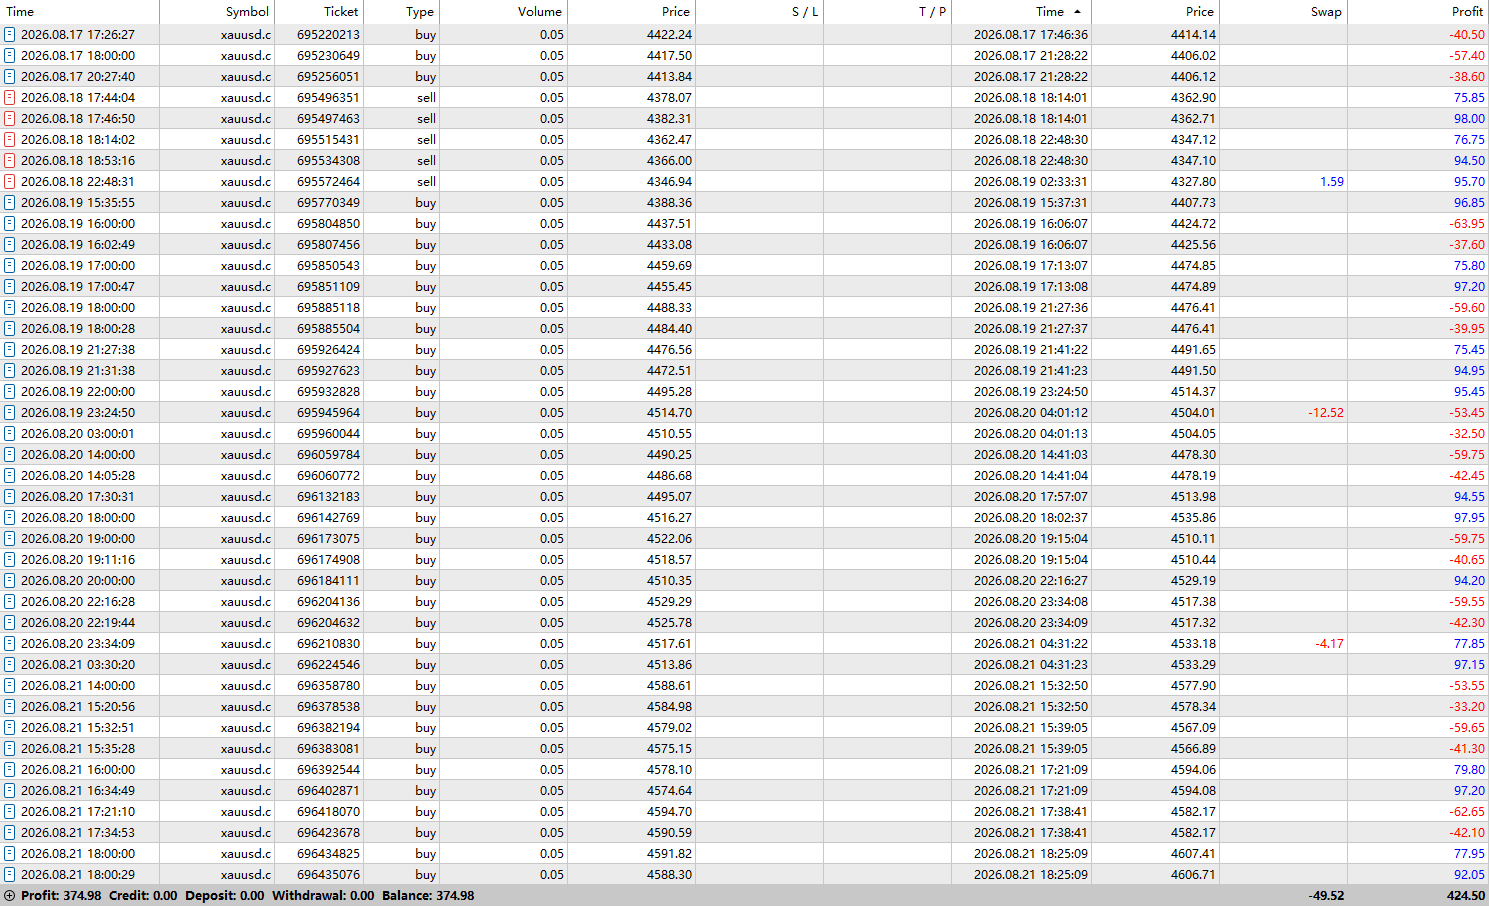
August 2026 finished with a net result of +374.98 USC across 112 XAUUSD trades. Closed-trade profit reached +424.50 USC, while -49.52 USC in overnight swap reduced the final monthly result. The month was far from consistently profitable. The EA spent the first half of August under pressure, with losing trades significantly outnumbering winners. The turnaround came during the final active trading week, when a much more balanced trade distribution produced enough profit to recover the earlier losses and move the month back into positive territory.

1

The first week, from August 3 to August 7, was difficult. The EA completed 43 trades but recorded only 14 winners. A strong sequence of buy trades on August 5 provided a substantial recovery, yet losses on the surrounding sessions outweighed those gains. The period finished at -205.21 USC after swap.

2

Conditions remained challenging during the following trading period. Several profitable positions still closed around the +90 to +116 USC range, but August 12 produced the most damaging sequence of the month. Two buy trades lost -143.70 USC and -136.60 USC, including the largest individual loss recorded during August.

3

The character of the results changed markedly from August 17. Sell positions performed well early in the week, and subsequent buy trades also captured several favorable moves. Rather than depending on one exceptional trade, the recovery was built from repeated gains generally ranging from around +75 USC to +100 USC.

4

The August 17–21 period ultimately generated +879.60 USC in trading profit. After -15.10 USC in swap, the net contribution was +864.50 USC. That single strong trading block was enough to reverse the accumulated losses from the earlier part of the month.

Total Trades

112

Win Rate

39.30%

Net Result

+374.98 USC

Largest Win

+126.95 USC

Largest Loss

-143.70 USC

Profit Factor

1.12

August demonstrates why win rate should not be viewed in isolation. Losing trades were more frequent than winners, but profitable positions were substantially larger on average, allowing the month to finish above breakeven. Trading profit totaled +424.50 USC, while -49.52 USC in overnight swap reduced the final net result to +374.98 USC. All performance figures are shown in USC account currency.

Monthly XAUUSD Trading Record Screenshot
Click to Expand
MT5 Account Statement — Monthly
Pattern Recognition

What the Records Reveal

Looking across multiple weeks and months, several consistent patterns emerge. These are not guarantees — they are observations from the recorded history, and they help set realistic expectations.

Frequency01

Clustering Effect

Wins and losses tend to cluster. A strong week is often followed by another strong week; a rough week often has company. This pattern reflects market regime persistence — when gold trends, the EA does well; when it chops, drawdown accumulates.

Recovery02
2-3×drawdown
duration

Recovery Is Real, But Slow

After drawdown periods, the account has historically recovered — but not quickly. Recovery often takes 2 to 3 times the duration of the drawdown itself. This is important for anyone considering going live.

Efficiency03
VOLUMEPROFIT

Volume Does Not Equal Profit

High trade-count weeks are not necessarily profitable weeks. Some of the busiest weeks were flat or negative. The EA trades when conditions meet its criteria, not when it guarantees a win.

Distribution04
6 / 11

Monthly Variability Is Normal

Over the recorded history, roughly 6 out of 11 months were positive, 5 were negative. That is a normal distribution for this type of strategy. Expecting 12 out of 12 winning months is unrealistic.

Risk Profile

Risk in Perspective

Every strategy has a risk signature. This one is recovery-based — drawdowns are part of the design, not a surprise. Understanding the full profile means looking beyond a single percentage: depth, duration, recovery patterns, and monthly consistency all tell the real story.

66

66.47%

Historical Maximum Drawdown

Reached once in recorded history and fully recovered. On a US Cent account, where the working balance is measured in cents not dollars, an equivalent nominal drawdown might be under $100 — far less alarming than the percentage alone implies. The account structure cushions the blow.

01

Depth + Duration

A 66% drawdown sounds catastrophic in isolation — but the time dimension changes the picture. The deepest historical drawdown lasted roughly 3 weeks before recovery began, and the account returned to its prior peak within 2 months. Duration matters as much as depth, because what wears traders down is not how far underwater they go, but how long they stay there.

02

Recovery Patterns

After each significant drawdown in the recorded history, the account recovered — consistently. Recovery typically takes 2 to 3 times the drawdown duration, driven by the EA's position-scaling logic that converts reversals into recovery trades. This is mathematical design, not luck. The trade-off is patience, not permanent capital loss.

03

Monthly Consistency

Over the recorded period, roughly 6 out of 11 months closed positive. Nearly half the months were red — and that is normal for this strategy. What matters is that profitable months tend to be substantially larger than losing months, producing a net-positive outcome over time despite the uneven distribution.

0.5 - 2%

Risk per Trade

8

Max Consecutive Losses

18 days

Avg Recovery Time

55%

Monthly Win Rate

These numbers describe the system's core behavior — not its flaws. The traders who get consistent results with this EA are those who fund it properly, let it run through drawdown cycles, and measure performance in months, not days.